Advanced Wireshark commands for network troubleshooting
Upcoming
9/20/20253 min read
In this section, we’ll be discussing the following Wireshark tools and filtering techniques that help in day-to-day network troubleshooting inside organizations:
Capture Filters vs Display Filters
Filtering by Protocols
IP Address Based Filters
Port-Based Filters
Combine Multiple Filters
Time-Based Analysis
Follow TCP/UDP Streams
Advanced DNS Troubleshooting
Performance Analysis (Latency & Retransmissions)
Export & Share Captures
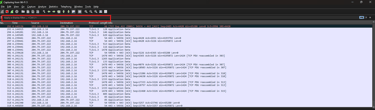
Capture Filters vs Display Filters
Wireshark provides two powerful filtering options: Capture Filters (applied before capturing traffic) and Display Filters (applied after packets are collected). Capture Filters reduce noise and improve performance, while Display Filters help refine the data already captured.
Capture only HTTP traffic:
tcp port 80
Display only packets from a specific IP:
ip.addr == 192.168.1.10
Use case: Reduce unnecessary packets and zoom directly into the traffic causing issues
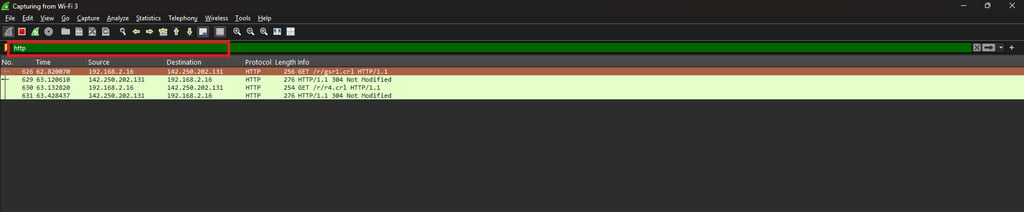
HTTP traffic only → http
DNS packets only → dns
ICMP (ping) traffic only → icmp
Filtering by Protocols
Wireshark can filter traffic by common protocols to isolate problems faster.

IP Address Based Filters
These filters let you focus on traffic from, to, or involving specific IP addresses.
Use case: Troubleshoot slow browsing (HTTP), DNS failures, or connectivity issues with ping (ICMP).
Source IP only → ip.src == 192.168.1.1
Destination IP only → ip.dst == 192.168.1.100
Any traffic involving a host → ip.addr == 10.0.0.5
Use case: Track suspicious or heavy traffic from a single device.

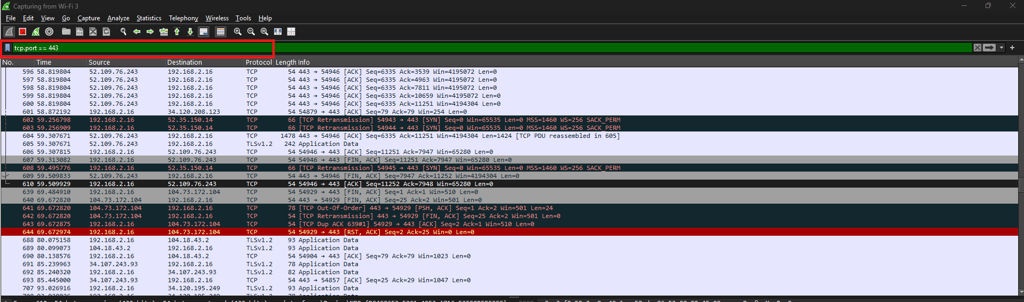
Port-Based Filters
Port filters are essential when diagnosing service-specific traffic like HTTPS or DNS.
HTTPS traffic → tcp.port == 443
DNS queries → udp.port == 53
High ports → tcp.port >= 1024
Use case: Investigate slow HTTPS connections, DNS failures, or suspicious high-port activity.
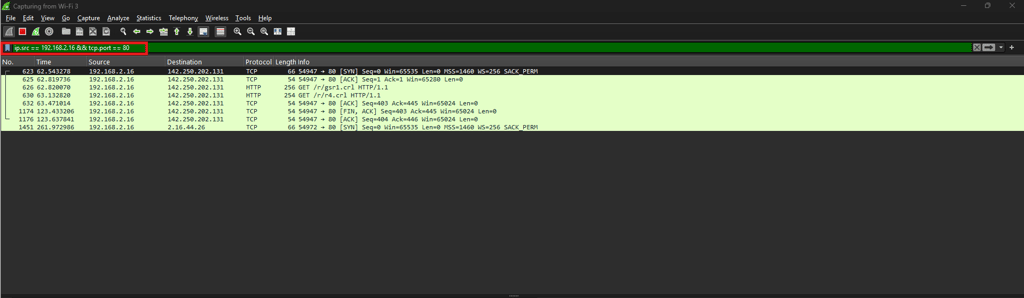
Combine Multiple Filters
You can combine multiple conditions for precise troubleshooting.
Specific IP and HTTP traffic → ip.src == 192.168.1.5 && tcp.port == 80
Traffic from either of two hosts → (ip.addr == 192.168.1.10) || (ip.addr == 192.168.1.20)
Use case: Troubleshoot issues between particular hosts and services.
Time-Based Analysis
Wireshark allows filtering packets by timestamps to narrow down incidents.
frame.time >= "2025-09-13 10:00:00" && frame.time <= "2025-09-13 11:00:00"
Use case: Analyze network packets during a specific outage window.
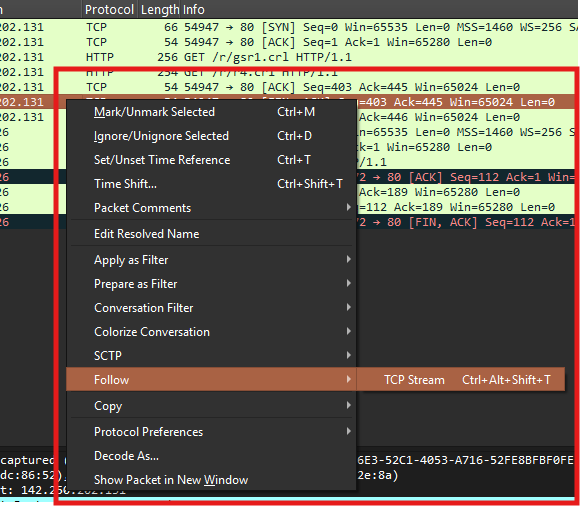
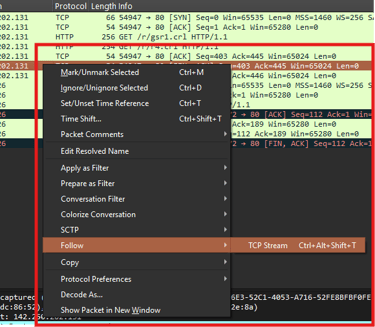
Follow TCP/UDP Streams
Right-click any packet → Follow → TCP Stream (or UDP Stream). This shows the entire conversation between endpoints.
Use case: Debug broken connections, view HTTP requests/responses, or detect suspicious data transfers.
Advanced DNS Troubleshooting
DNS filters help detect failed lookups or misconfigured servers.
Filter by domain → dns.qry.name == "example.com"
Find failed queries → dns.flags.rcode != 0
Use case: Identify DNS latency or failed lookups impacting applications.

Performance Analysis (Latency & Retransmissions)
Wireshark includes filters for analysing network performance issues.
Retransmissions → tcp.analysis.retransmission
Round-trip time (RTT) → tcp.analysis.ack_rtt
TCP analysis flags → tcp.analysis.flags
Use case: Detect packet loss, delays, and retransmissions that slow down the network.
Export & Share Captures
You can export specific packet results for collaboration.
Navigate: File → Export Specified Packets
Save filtered results in .pcapng format
Use case: Share filtered captures with teammates or security analysts for deeper investigation.
EasyHacks.Tech
Daily IT Support Blogs & Insights
© 2025 EasyHacks.Tech | All Rights Reserved